NDIS 2031 modelling: what the conference projections can tell you
NDIS 2031: the modelling on who stays, who goes, and what it means for providers
By Clickability · Originally published 24 August 2026
Original article and dated context
If the reforms pass roughly as drafted, what does the NDIS actually look like in 2031? Loki Ball of the analytics firm Performl walked through detailed modelling to answer that, calibrated against Treasury's own numbers, and delivered with the personal weight of someone whose brother is a high-needs participant. The headline: the scheme becomes smaller, but deeper.
Three cohorts, three very different futures
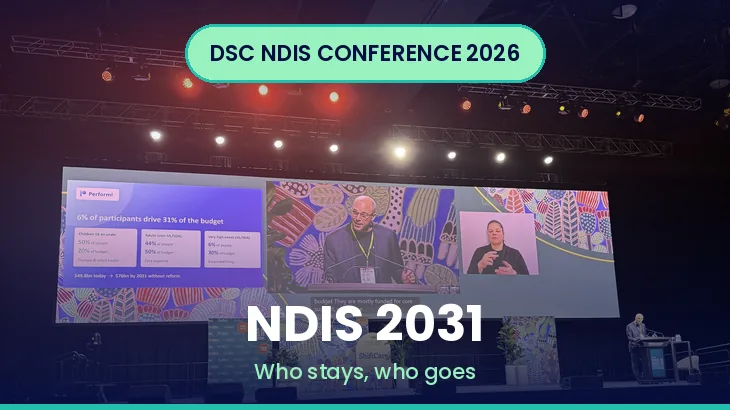
Ball framed the scheme as three groups. The first is children accessing paediatric therapy and allied health, with utilisation around 68%; this cohort faces the most disruption from Thriving Kids. The second is roughly 300,000 adults with permanent, significant disabilities who live outside supported independent living (SIL) and specialist disability accommodation (SDA), holding smaller plans; they are about 44% of participants and half the budget, but have much lower utilisation and have never drawn the same supplier response. The third is the very high support needs group in SIL or SDA, only about 6% of people but around 31% of the budget, with utilisation of 95% and above. There is, he said, vast unmet need and fierce competition for SIL and SDA support.
[Clickability update, September 2026: The figures below belong to a dated modelling scenario. Annual spending differences in 2031 and cumulative savings over several years measure different things; do not compare them as the same amount.]
The size of the change
The scheme grew about 45% in four years, with payments around $50 billion last year. Participant numbers have been rising about 5% a year and payments faster, at 8 to 10%, driven by wages and indexation and a shift toward higher-needs participants as the scheme matures. Treasury's no-reform projection was roughly 944,000 participants and about $76 billion by 2031. The ten reform measures are projected to run the scheme about $20 billion a year below that, with 346,000 fewer participants, around a third of the projected scheme. Crucially, the status quo and reform paths are identical until June 2027 and then diverge fast, with three-quarters of the savings landing in the final two years. In other words, the reform is legislated now but bites two years later. By 2031 the scheme is about 64% of its no-reform size by participant count and 74% by spending, and because those who leave have smaller-than-average plans, the average payment per remaining participant actually rises about 17%, to roughly $94,000. Smaller, but deeper.
[Clickability update, September 2026: These modelled cohorts do not identify who will actually leave or be refused access. The final criteria, implementation and an individual decision matter. Check current access and transition guidance.]
Who leaves, and who never arrives
Ball's model tried to identify the 346,000. Treasury projects 241,000 current participants exit by 2031, reassessed against a new objective functional capacity test and the access changes enabling Thriving Kids. Performl's cell-level model suggests about 150,000 of those (62%) are likely participants with autism, another 57,000 have developmental delay, and the exits are heavily concentrated in children (around 96,000 aged 0 to 8 and 67,000 aged 9 to 14), on plans averaging $30,000 to $60,000. Some children are expected to move to Thriving Kids; others will rely on mainstream health and education, family, or in some cases nothing formal. He was careful to caveat that the actual selection depends on how the functional capacity test is operationally designed.
A further 105,000 people never join, what he called the inflow gap. The largest driver is a reduced front door: gross entries falling from about 80,000 a year today to around 30,000 by the end of the decade, a 38% reduction. Put the exits and the inflow gap together and 70% of the full reduction is children under 15, with autism accounting for around 216,000, more than halving the projected autism population. By contrast, cohorts with high and consistent needs, such as cerebral palsy, Down syndrome and spinal cord injury, are unlikely to see meaningful reductions.
[Clickability update, September 2026: The arithmetic in this sentence is incorrect: a fall from 80,000 to 30,000 is a 62.5% reduction. The remaining amount is 37.5% of the original. This corrects the calculation only, not the model’s underlying forecast.]
Where the $38 billion comes from
The projected $38.1 billion in savings is not spread evenly; four of the ten measures deliver 78% of it. The single largest is the reset of social and community participation, allied health and therapy budgets, about $13.2 billion, or a third, and these are the supports in almost every plan. The objective functional capacity test accounts for $9.3 billion, the new framework growth caps about $3.9 billion, and reassessment tightening and limits on unspent funds about $3.1 billion. Structurally, two measures save money by removing participants ($9.8 billion) and the other eight by reducing plans for people who stay ($28.3 billion), so nearly three-quarters of the savings come from smaller plans for those who remain.
The catch on "protected" supports
Government has said home-and-living and employment supports will not be cut, and Ball took that at face value in the model, but was sceptical it can be delivered cleanly. His brother, for instance, uses his daily-living budget to attend paid and voluntary work, and his community participation budget to top up insufficient in-home support, all under broad line items that make it hard for the agency to see which dollars protect a job. A 50% cut to community participation, he argued, would in practice hit both home supports and work participation. Performl estimates about 30% of the budget-reset burden falls on the SIL and SDA cohort, roughly $1.4 billion a year by 2031.
The scheme that remains
Post-reform, the 2031 scheme spends about $56 to $58 billion on 598,000 participants. The SIL and SDA cohort keeps growing, from around 42,000 today to an estimated 52,000 by 2031, with cohort spending rising from about $19 billion to somewhere between $25 and $29 billion. SDA demand is real and currently unmet: payments grew 36% a year over two years, around 9,400 eligible people are not yet using it, and the NDIA's own trajectory points to about $1.8 billion and more than 30,000 SDA participants by 2033. The remaining scheme skews to adults with complex, persistent needs, with psychosocial and intellectual disability populations largely retained and adults over 35 reduced only 11 to 16%. Ball's summary: this is not simply a shrinking sector, it is one being reshaped toward complexity, adulthood and housing, with genuine growth in the higher-needs segments.
[Clickability update, September 2026: The recommendations below are the conference interpretation, not a guarantee of demand or revenue. Verify your own service capacity, market and scenarios before committing resources.]
What this means for providers
For providers with proven capability in complex support, SIL, SDA and specialist accommodation, the modelling is an argument to scale and plan with some confidence, since demand there grows. Paediatric and lighter-touch therapy providers face the most disruption and should be planning for Thriving Kids and a smaller NDIS front door. Employment supports remain the scheme's least-utilised area (around 33%) and a growth opportunity.
What this means for participants and families
The hardest news is for families of children with autism and developmental delay, who make up the bulk of projected exits, with Thriving Kids or mainstream services intended to pick up support outside the scheme. People with high and consistent needs are far less likely to be affected. Ball's caveat matters: much depends on how the functional capacity test is actually designed, which is still being worked out.
What this means for support coordinators and intermediaries
The "protected supports" complexity is one to watch closely, since the line items people use to fund work and community participation are exactly the ones facing resets. Helping participants document how their supports are used, especially where they enable employment, may matter a great deal.
Meet the speaker
Loki Ball, Co-Founder and Co-CEO, Performl Loki co-leads Performl, an analytics firm modelling the NDIS market, and brings the lived-experience perspective of a family member of a high-needs participant.
Read the full 2027 NDIS changes summary from the reforms reshaping the NDIS to who's expected to stay or go and the crackdown on unscrupulous providers, we've pulled every hot topic and its likely outcome into one quick overview, then gone deeper on each with its own explainer written for both providers and participants, Q&A included. Get the lot in the DSC NDIS Conference 2026 wrap-up.
A note on this series: this is Clickability's plain-English summary of a session at the DSC Annual NDIS Conference 2026, held on 14 August 2026. The figures are Performl's modelling calibrated to Treasury projections and were caveated by the speaker; they are projections, not certainties, and are not the official position of Treasury, the NDIA, DSC or Clickability. This is not financial or NDIS advice.
Clickability editorial update: September 2026
How providers can test a scenario before making a commitment
Ask for the model’s date, assumptions, baseline and whether amounts are annual or cumulative. Compare the scenario with the enacted rules and your own service data. Identify what would change if the timetable or projected demand differs.
Keep investment decisions separate from the certainty of a headline. A projected high-needs market still requires the right workforce, safeguards and actual participant demand. Do not assume a diagnosis or plan size predicts a referral.
How participants can read a model without treating it as a notice
A population forecast does not determine your access, support hours or review date. Look for an individual NDIA decision and ask what criteria and process apply to you.
If you want help interpreting a decision, bring the letter and current plan rather than relying on where a modelling chart places your diagnosis. Your practical needs and the applicable rules require individual consideration.
Questions readers ask
Does the modelling identify who will lose access?
No. It projects groups under assumptions; it is not an individual decision or a verified list of exits.
Is 80,000 to 30,000 a 38% reduction?
No. It is a 62.5% reduction, leaving 37.5% of the original amount.
Find providers for your actual support needs
Describe the support you need through Clickability. Browse reviewed and rated profiles and discuss your requirements directly with relevant providers.