NDIS safeguarding benchmarks: questions for provider quality
Are you measuring up? What the sector's biggest safeguarding benchmark reveals
By Clickability · Originally published 18 August 2026
Original article and dated context
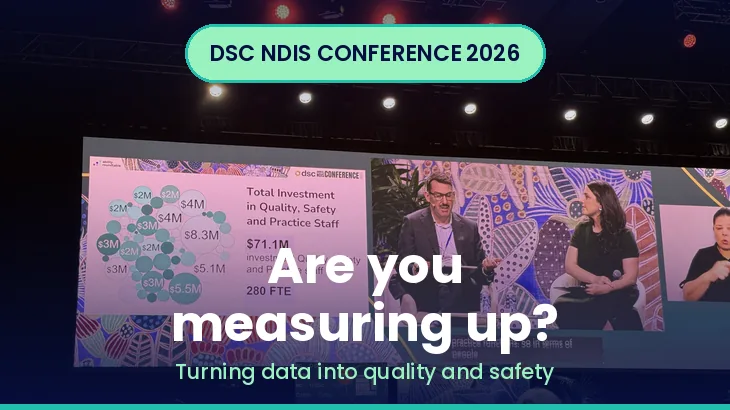
After the morning's rapid tour of NDIS reform, DSC turned the lens inward, to what providers can actually control: what happens inside their own organisations. Managing Director Evie Naufal introduced the new DSC and Ability Roundtable report, Counting What Matters: Quality, Safety and Safeguarding in the NDIS, and was joined by Garry Simpson, Chief Operating Officer of Ability Roundtable, for a preview of the data.
The benchmark is now the largest sector-led quality and safety initiative in the country. This year it drew on 59 registered providers, representing 67,000 NDIS participants, more than 66,000 workers and 63.9 million direct service hours, using 2025 calendar-year data across three pillars: safeguarding, investment in workforce quality and safety, and worker safety. Results are standardised per 100,000 hours of direct support, so organisations of different sizes can be compared fairly.
[Clickability update, October 2026: These figures describe the reported sample of participating providers, not every NDIS participant or provider. Do not extend sample medians to national prevalence.]
The sector is largely funding its own quality
One of the headline findings: across those 59 providers, more than $71.1 million was spent in a single year on quality and safety staff and clinical and practice functions, the equivalent of 280 full-time roles. The median organisation invested around $103,400 per 100,000 hours of support, with a further $24.7 million going into staff training and professional development and $5.8 million into active support and frontline practice leadership. All of that in 2025, in an environment of real financial pressure.
The catch, as Evie put it, is that NDIS pricing does not reflect any of this. It is a single price regardless of how much a provider invests in quality. The long-running call for differentiated pricing has, in her words, been answered "in classic NDIS style" by lowering some prices rather than lifting the ones that earned it. To make the case for pricing that rewards quality, the sector will need hard evidence of the outcomes that investment produces.
Good at counting harm, not yet at measuring benefit
That was the thesis of the session. Providers are very good at counting harm, because the regulatory framework requires it. The benchmark medians bear that out: eight reportable incidents per 100,000 hours (rising to ten for organisations primarily delivering supported independent living), 15 unauthorised restrictive practices with chemical restraint by far the most common, 4% of clients subject to a regulated restrictive practice (8% for SIL), and 6.9 complaints with a median 24 days to resolve.
Where the benchmark pushes further is impact. Rather than just counting restrictive practices, it tracks how many are eliminated using fade-out techniques, how many unauthorised uses trace back to an expired behaviour support plan, and how many are driven by external factors like tribunal or guardianship decisions. That shift, from counting events to understanding them, is the point.
The high-intensity funding gap
A striking gap surfaced in home and living supports. A median of 9% of participants received high-intensity funding, but another 12% met the eligibility criteria and were not funded. That matters because those providers still need high-intensity-trained staff on hand to keep people safe, funded or not.
Implemented versus embedded
A new SIL practice standard landed the month before the conference, with compliance expected almost immediately. Readiness varied. Active support was fully implemented by 46% of providers (with 22% saying it was also embedded and regularly reviewed), frontline practice leadership by 37% (17% embedded), and a practice framework by 38% (24% embedded). Systems to help participants understand their tenancy rights were in place at 64% of organisations, though nearly a quarter did not yet have them.
The recurring theme was the distinction between "implemented" and "embedded and regularly reviewed." Compliance can be achieved on paper, through policies and documentation. But the data suggested sustained quality shows up where practices are genuinely embedded and reviewed as part of a continuous improvement cycle, not just written down.
What actually correlates with fewer incidents
Correlation is not causation, as Garry was careful to note, but several relationships were statistically significant. Greater implementation of active support was linked to lower rates of reportable incidents and complaints. SIL providers with embedded supported decision-making frameworks showed fewer unauthorised restrictive practices, dropping from 20.7 to 12.2 per 100,000 hours. Client advisory committees, one way of embedding participant voice in decisions, were linked to fewer reportable incidents, as were systems supporting tenancy rights. Unsurprisingly, higher workers' compensation claims were associated with more reportable incidents.
Inclusive governance, now measured
For the first time, the benchmark looked at disability representation on provider boards. Representation averaged about 13%, with 62% of participating organisations having at least one person with disability on their board, and some above 50%. Others, in Garry's words, "haven't quite left the starting line." It is now a baseline the sector can track year on year.
The polypharmacy alarm
The starkest clinical finding was polypharmacy, commonly defined as taking five or more medications at once, or two or more psychotropic medications. A median of 23% of participants were affected, rising to 35% for SIL providers, and as high as 70% in some organisations. The NDIS Commission expects people experiencing polypharmacy to have a medicine review every three to six months, yet only 2% had received a pharmacy medication review in the past year. Higher polypharmacy was linked to more compliance issues, and the Commission has made it a focus, particularly where it connects to managing behaviours of concern. Other health indicators told a similar story: a median 30% of participants had an unplanned hospitalisation, and only 76% had a healthcare plan in place, when it should be 100%.
[Clickability update, October 2026: The Commission’s polypharmacy practice alert recommends medication review every three to six months by a medical practitioner or pharmacist. Do not change or stop medication based on this article; discuss the individual regimen with the treating team.]
What this means for providers
The report is a mirror. It shows where you sit against your peers on investment, safeguarding and clinical practice. Two moves stand out. Move from "implemented" to "embedded and regularly reviewed," because that is where the data shows quality actually lands. And start measuring benefit, not just harm, so you can evidence the outcomes that justify a case for better pricing. If you deliver SIL, the polypharmacy and medicine-review gap is an urgent one to check in your own numbers.
What this means for participants
The benchmark is, at heart, about your safety and wellbeing. Two findings are worth knowing. Many people are on five or more medications with very few getting a regular pharmacy review, so it is reasonable to ask your provider or GP when your last medicine review was. And having your voice built into decisions, through things like client advisory committees and supported decision-making, is not just nice to have; it was linked to fewer serious incidents.
What this means for support coordinators, LACs and intermediaries
The high-intensity funding gap is one to watch, since a meaningful share of people meet the eligibility criteria but are not funded, which can leave holes in safe support. Knowing the benchmark exists also helps you ask providers sharper questions about their safeguarding and clinical practice, and to push for medicine reviews where polypharmacy is in play.
What this means for boards and leaders
Inclusive governance is now measurable, and most participating organisations have at least one director with disability, though overall representation sits near 13%. If your board hasn't left the starting line, this is a visible, trackable place to lead. The embedded-versus-implemented lesson is a governance one too: ask not whether a policy exists, but whether it is reviewed and lived.
The session's challenge was a simple one. The sector has spent years getting good at counting what goes wrong. The next stage of maturity is getting just as good at measuring what goes right. The full Counting What Matters report is on its way.
Meet the speakers
Evie Naufal, Managing Director, DSCLinkedIn Evie has been part of DSC since 2014 and now leads it as Managing Director. With a Masters in Sustainable Development from HEC Paris and earlier human-centred design work at Procter & Gamble, she has been central to DSC's content-led approach and is well known in the sector for her work on support coordination.
Garry Simpson, Chief Operating Officer, Ability RoundtableLinkedIn Garry leads operations at Ability Roundtable, which runs Australia's largest benchmarking platform for disability providers, used by more than 100 member organisations. He brings around 15 years across major government policy reform, including earlier roles as an NDIS policy adviser and at the NDIA, and is based in Adelaide.
A note on this series: this is Clickability's plain-English summary of a session at the DSC Annual NDIS Conference 2026, based on what was said on the day (13 August 2026). It reflects our interpretation and is not the official position of DSC, the speakers or the NDIA, and it is not NDIS or employment advice.
Clickability editorial update: October 2026
Use the benchmark to investigate your own practice, not to claim causation
Check definitions, reporting periods, sample coverage and comparable service hours before comparing rates. Ask whether apparent improvement reflects practice, reporting changes or another factor. Ability Roundtable describes its benchmarking approach; the conference correlations do not prove that one intervention caused fewer incidents.
Turn findings into specific questions about participant involvement, complaints, staff supervision and review of practice. Keep clinical medication decisions with the relevant health professionals.
Ask what quality and safety look like in your actual support
Ask how you can raise concerns, how your views affect decisions and who explains changes to your support. If medicines concern you, ask the treating practitioner or pharmacist about a review. A provider’s benchmark participation is not a guarantee of your individual experience.
Questions readers ask
Are the benchmark figures national prevalence estimates?
No. They describe the reported participating-provider sample.
Should I change medicines because of the polypharmacy figures?
No. Discuss your individual regimen with the treating practitioner or pharmacist. Official guidance
Find providers to ask about quality and safeguarding
Describe the service you need through Clickability. Compare profiles and reviews and ask how providers involve you, respond to concerns and maintain safe support.